You require to login to see the pictures.
Author: Michael James
-
Week 60 – May 3rd – Week 4 of lockdown easing phase 2
Some pictures from a trip to Greenwich.
Your need to login to see.
-
Week 59 – April 26th – Week 3 of lockdown easing phase 2
Some further pictures of the new bathroom.
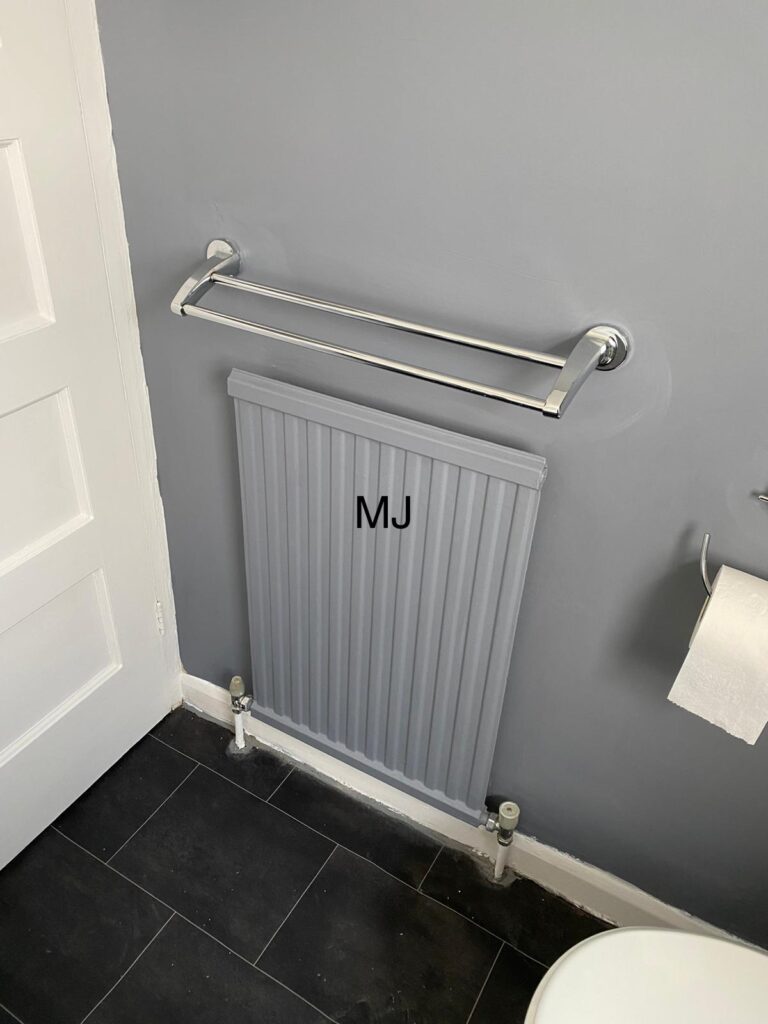
Radiator given a make over, with new towel rail and toilet holder 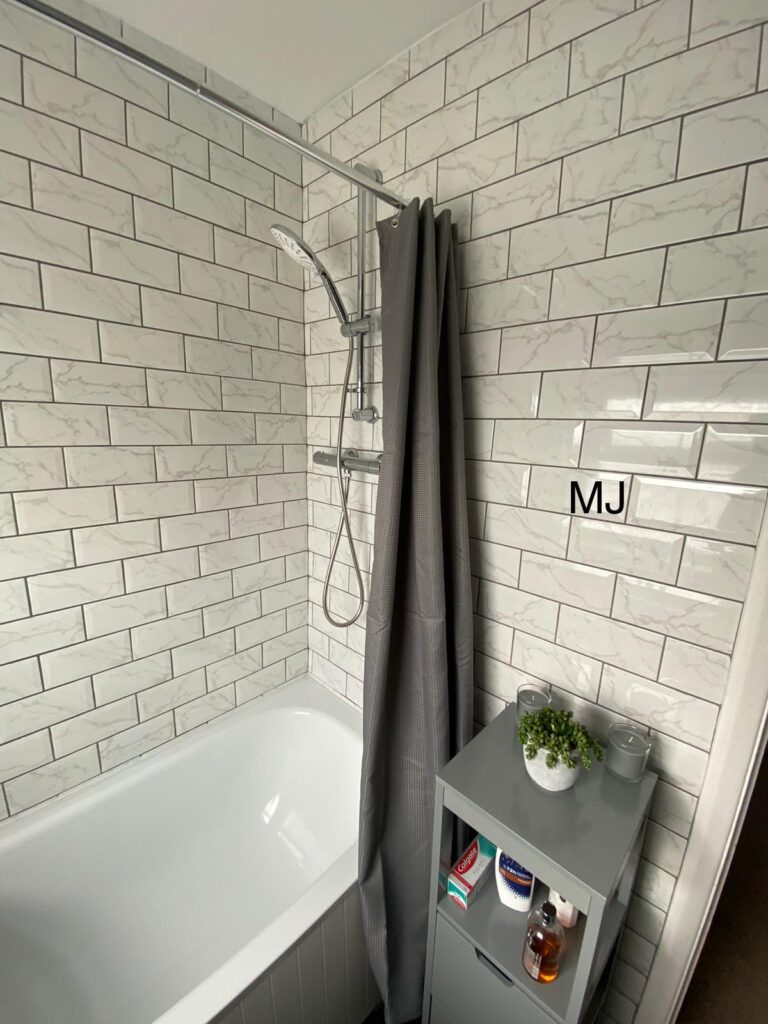
New shower and curtain 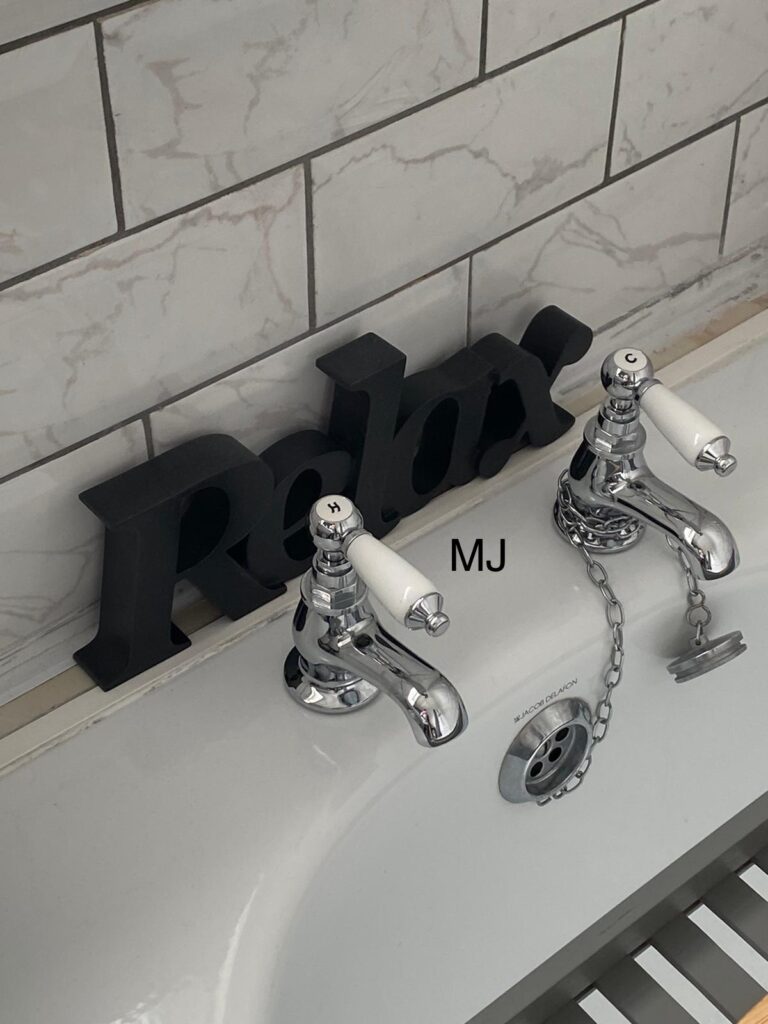
New taps and Relax 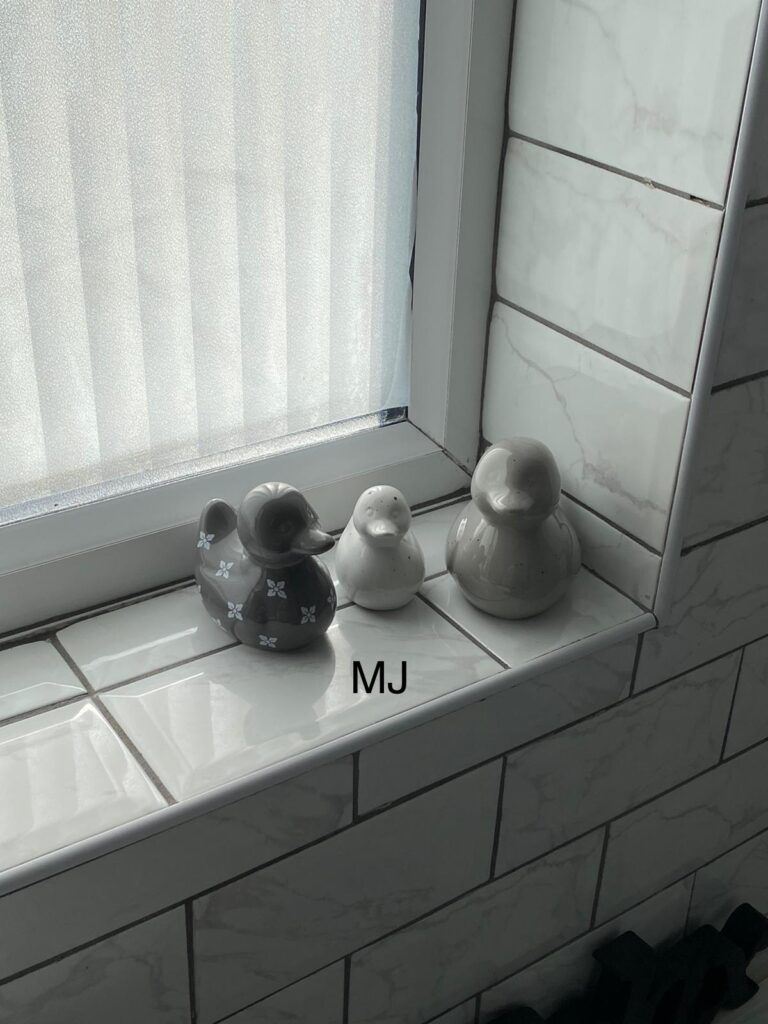
Quack 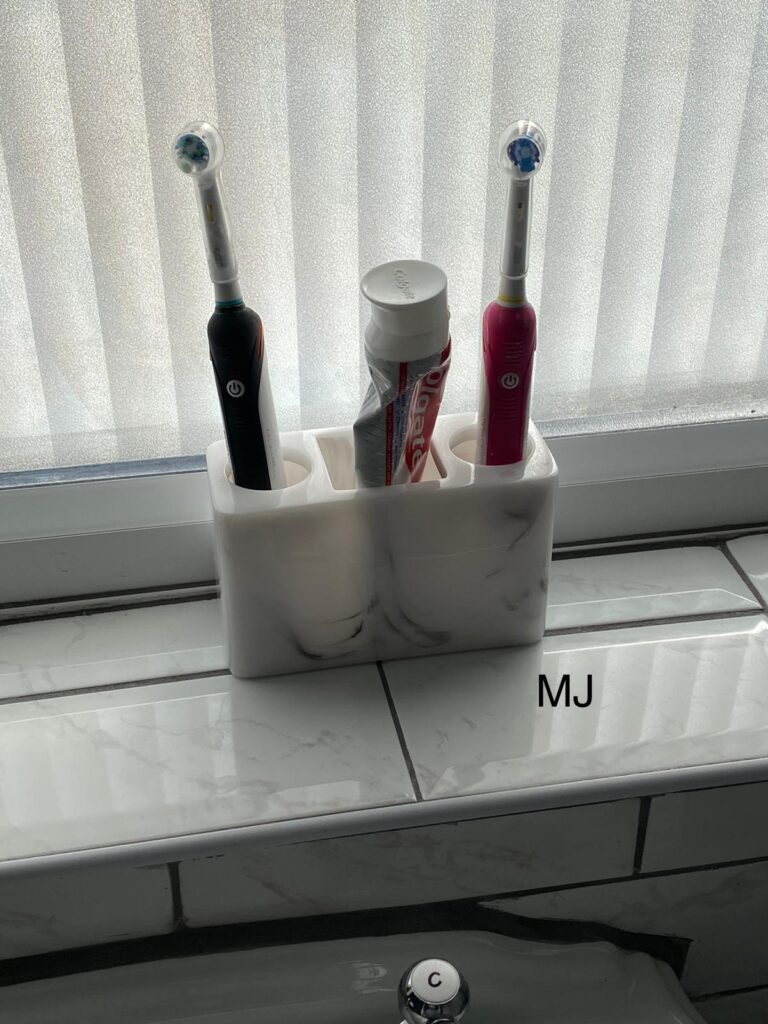
New brush holder. -
Week 59 – April 26th – Week 3 of lockdown easing phase 2
Here is the new bathroom, what do you think?

New tiles in the bathroom. 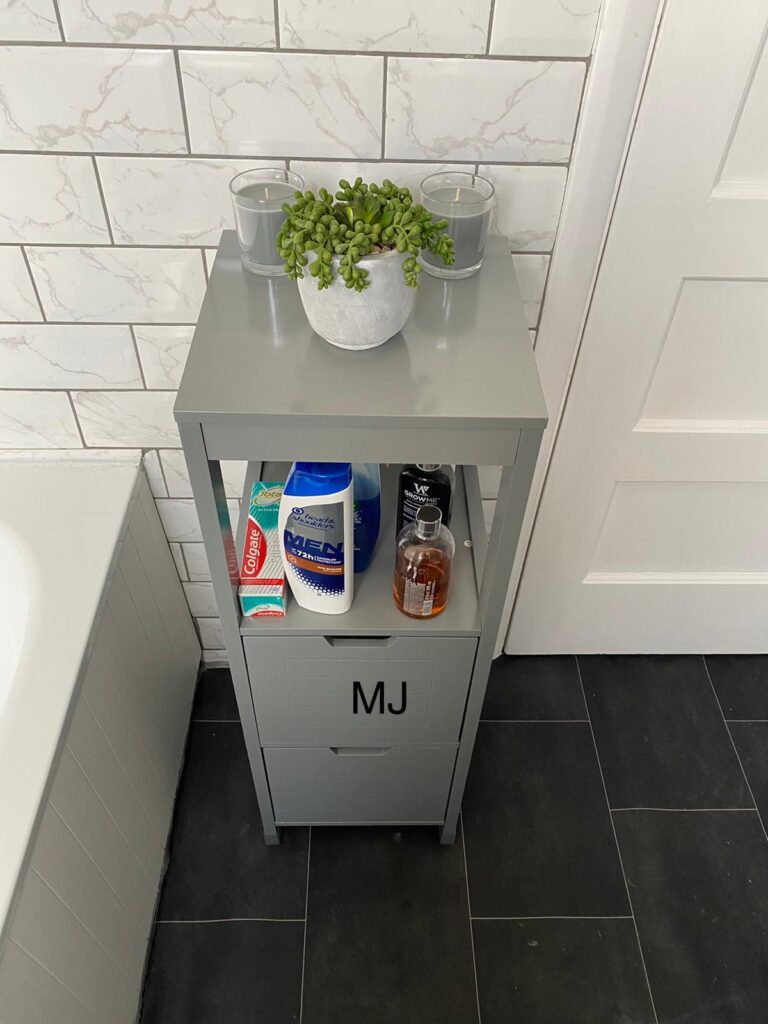
New unit in the bathroom 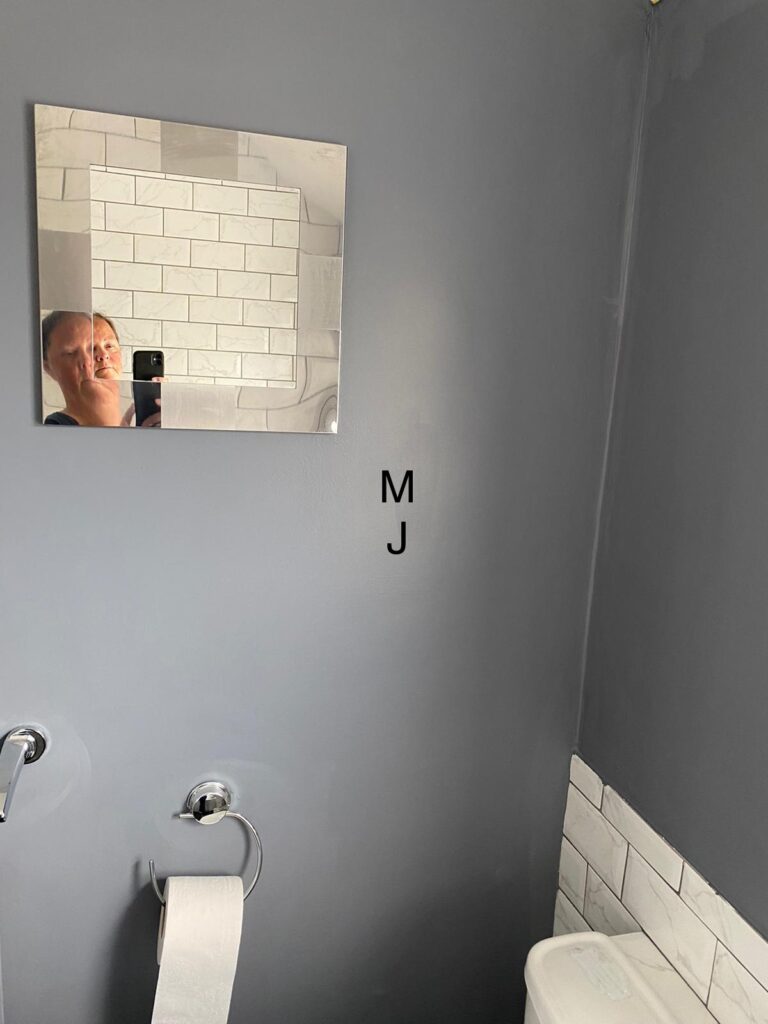
Painted wall. 
Some further pictures in the next posting.
-
Week 59 – April 26th – Week 3 of lockdown easing phase 2
More pictures and video from the Leeds castle visit.
-
Week 59 – April 26th – Week 3 of lockdown easing phase 2
More pictures from the Leeds castle trip.
Login in time.
-
Week 59 – April 26th – Week 3 of lockdown easing phase 2
Some more pictures from the visit to Leeds castle.
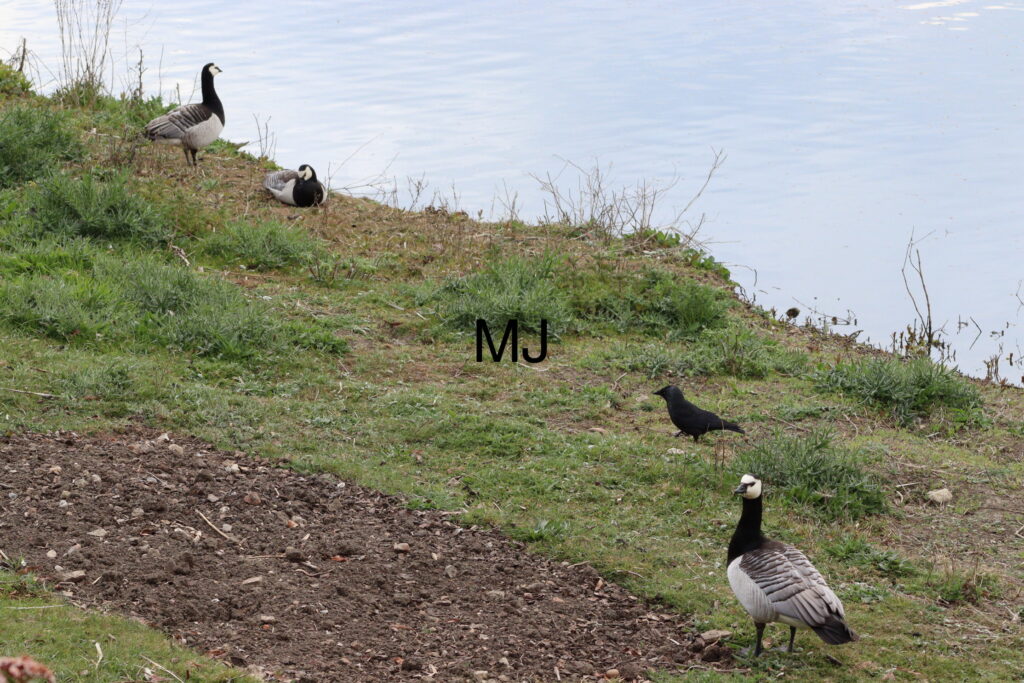
Various birds near the lake 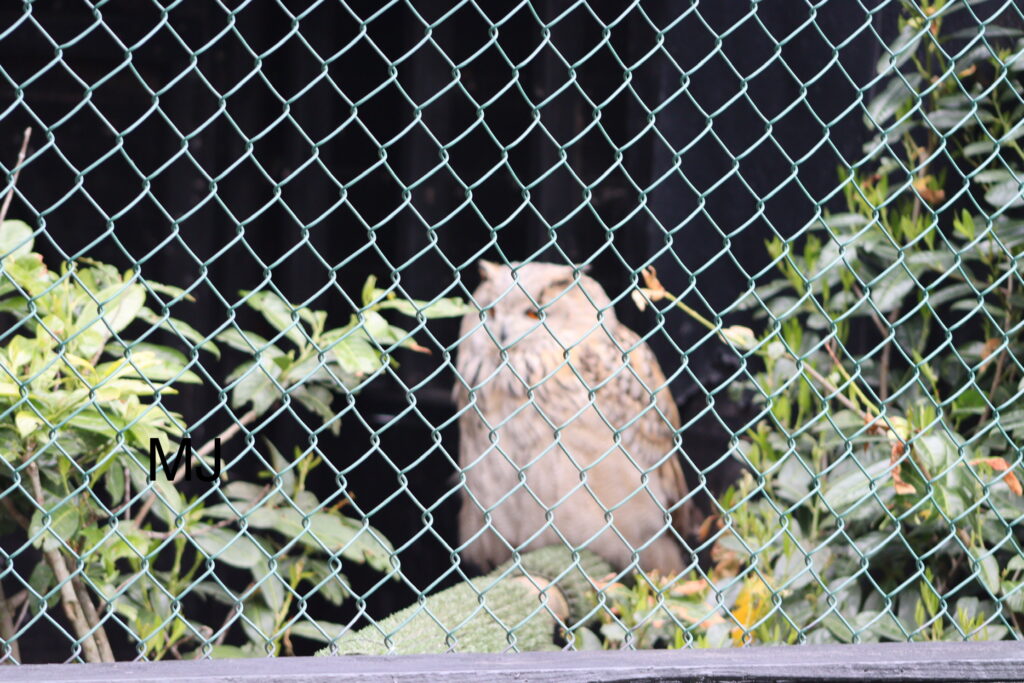
Siberian Eagle Owl at the birds sanctuary in Leeds castle. 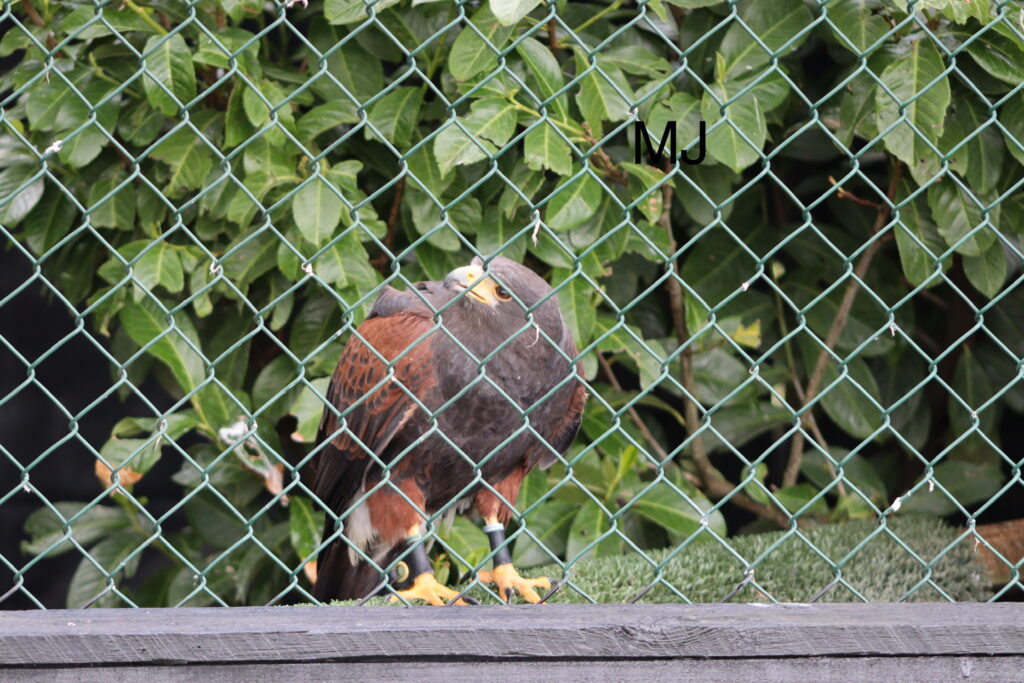
Aplomado falcon 
-
Week 59 – April 26th – Week 3 of lockdown easing phase 2
More pictures from the Leeds castle visit, but your need to login again.
-
Week 59 – April 26th – Week 3 of lockdown easing phase 2
With lockdown easing, we returned to Leeds Castle.
Your need to login to see these pictures.
-
Week 59 – April 26th – Week 3 of lockdown easing phase 2
The markets quartley review.
The last year is already fading quickly into the rear-view mirror and, as new life blooms around us, our thoughts are shifting to the year ahead rather than the long and hard winter behind us. So, too, have stock exchanges cast off the gloom of a seemingly endless series of lockdowns.
How are things at the moment?
You may be familiar with the Fear & Greed indicator, produced by CNN Money. This starts with the basic premise that the major factors driving short term moves in share prices are the two most basic of human emotions – fear and greed. When investors are fearful, they will tend to sell – often irrationally – while after a period of strong gains, investors can often become irrationally greedy, paying scant attention to prices, leading to potentially overextended stock market levels. Both sit at extremes of behaviour and the purpose of the dial is, by looking at a number of different indicators, to come up with an indicator of where we sit at present.
The current level shows markets are feeling optimistic, but not necessarily excessively so. Those with longer memories and harder nerves might remember that last March, at the peak of the pandemic, the dial sat in single figures, highlighting the complete collapse of confidence that shares suffered. Since that period, however, stocks have rallied extremely sharply, with many markets hitting multiyear high levels.